Role
Product Designer
Duration
4 Months
Tools
Figma, Google Analytics, Hotjar
Team
Software Developer, Digital Marketer
Platform
Web Mobile / Desktop

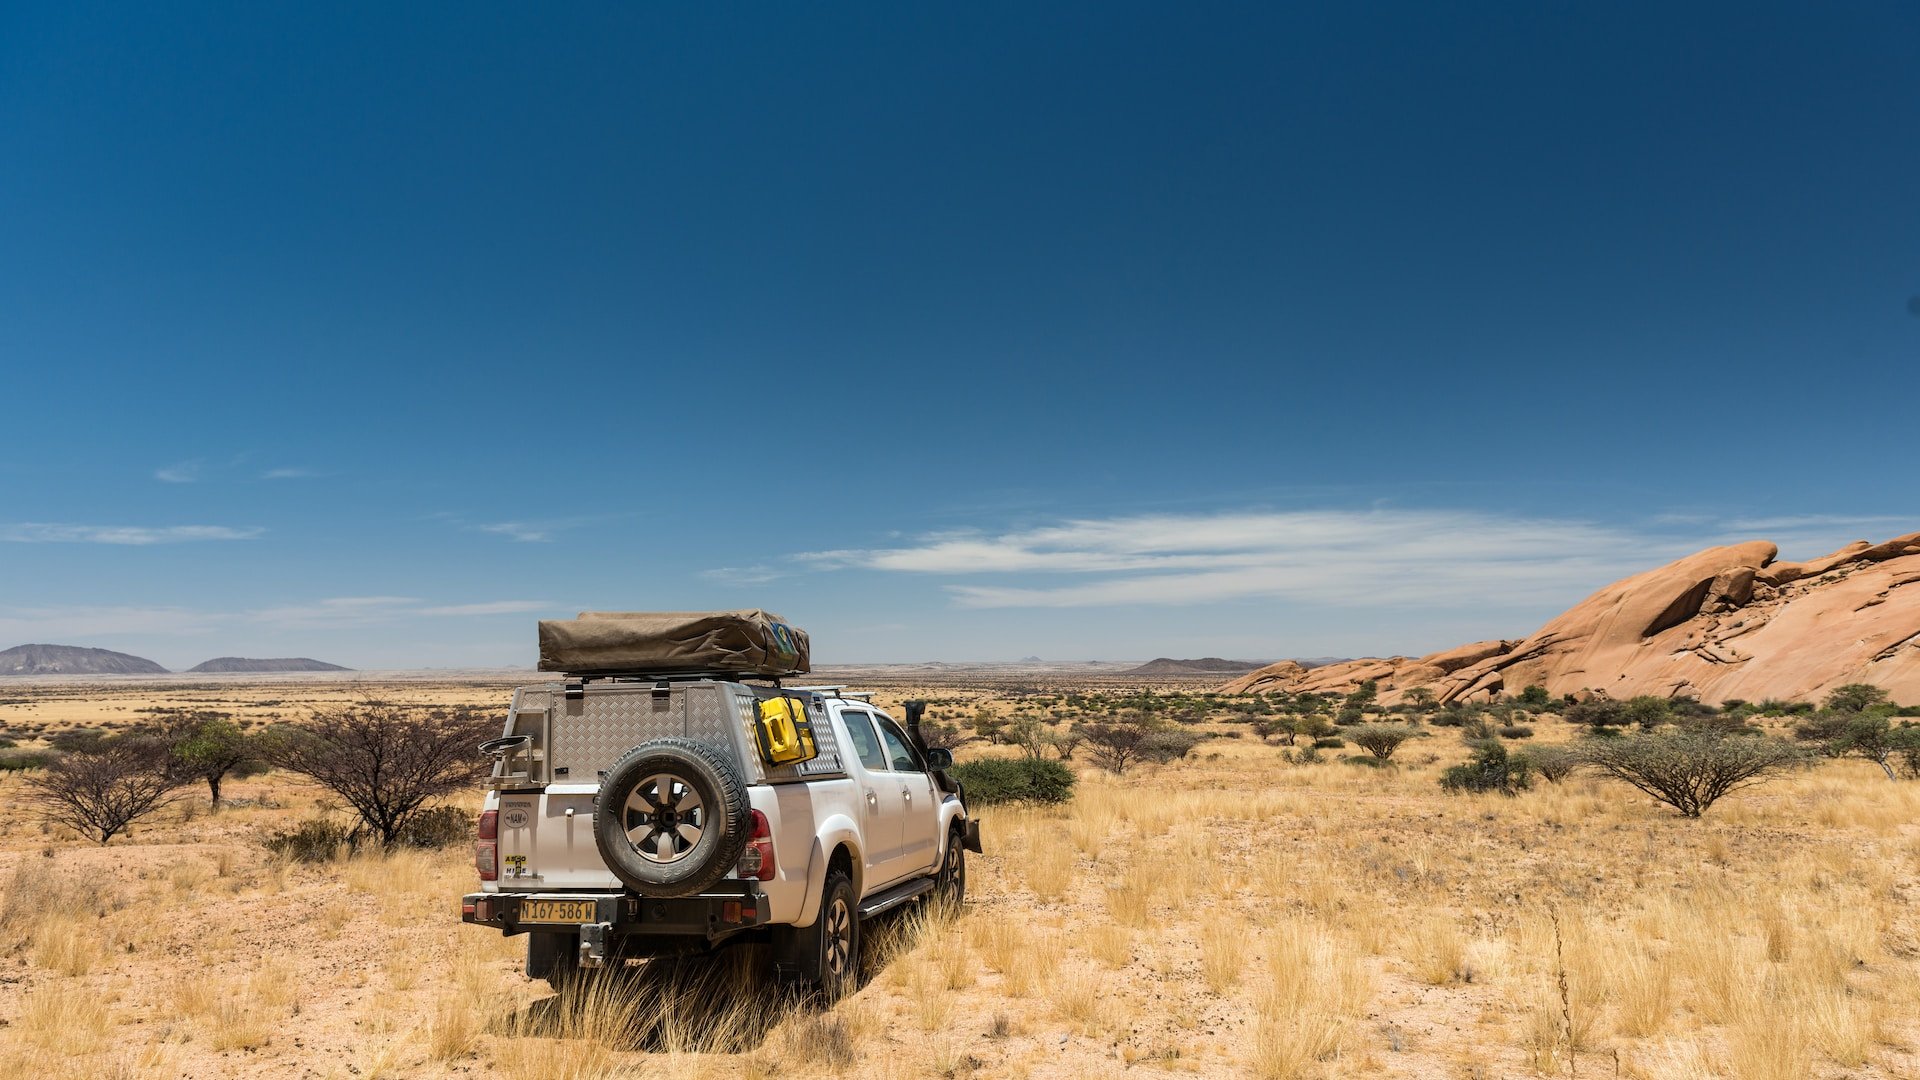
First Impression Experience Redesign
Imagine walking into a store where the entrance is cluttered, lighting is dull, and no one to greet you, would you stay and shop? Probably not.
Overview
Problem
The homepage felt more like a barrier than a welcoming store for new visitors, with a clunky fitment tool, dull visuals, and a frustrating shopping experience, leading to a high bounce rate and lost sales.
Objectives
Balance fitment tool placement with product discoverability
Improve visual appeal and brand trust
Guide users with a more engaging and dynamic hero section
Solution
Redesigned the first impressions of the home page to be more engaging, visually appealing, and easy to use while keeping the fitment tool accessible and improving discoverability.
Impact
Over three months, Google Analytics showed bounce rates dropped from 80% to 30%, while conversions tripled from 0.7% to 2.1%.
Key Screens


Understanding the Problem
Research
The first step was to understand exactly why users were leaving so quickly and what was preventing them from engaging with the homepage.
Rather than guessing, we turned to user research to uncover the user’s motivations, pain points, and expectations.
We used a variety of user research methods:
User interviews
Heat mapping; and
Competitor analysis
Issues Uncovered & Pain Points

1️⃣ Unappealing and Unengaging Design
Heatmaps showed users tapping on the static banner and icons, expecting interaction, but nothing happened. Users also found the dull red and gray colors uninspiring and makes the site feel untrustworthy.
2️⃣ Frustrating “Select Your Ride” Feature
The fitment tool took up half the mobile screen, users felt compelled to interact with it before exploring the home page. Many users found it intrusive and frustrating.
3️⃣ Lack of Personalization Compared to Competitors
Compared to other competitors, users wanted vehicle-based recommendations and found it annoying to re-enter their vehicle details every time they searched for a new item.
Designing a Solution
How Might We
At the end of the discovery phase, I held a design jam session with How Might We questions that framed our insights into opportunities, sparking a brainstorming session with key stakeholders, including developers, marketers, and myself.
HMW Questions:
HMW make the fitment tool less intrusive so users can explore the homepage freely?
HMW improve the visual appeal and dynamism on the home page?
HMW simplify search by allowing users to save their vehicle details?
Ideation
I started with the biggest challenge, making the fitment tool less intrusive.
Step 1:
I did this by moving the tool into a collapsible section with a car icon, freeing up half the homepage for browsing.
Step 2:
With the tool now collapsible/hidden, I designed the expanded state where users enter and manage their vehicle details, turning it into a digital garage.
I created two design variations for each of these two key screens:
1️⃣ Homepage with a collapsed fitment tool
2️⃣ Digital garage for saved vehicles
Usability Testing & Iterations
1️⃣ First Impressions Page

Design A: Dynamic Category Layout
🔹 This encourages product discovery by allowing users to freely explore by categories.
⚠️ Issue: Some users felt overwhelmed and unsure where to start.
Design B: Hero Banner Layout
🔹 Highlighted promotions with a strong CTA and improved navigation by keeping categories above the fold.
✅ Most users (9/10) preferred Design B because it was clearer and easier to navigate.
⚠️ Issue: The car icon for the fitment tool was too small and easy to miss.
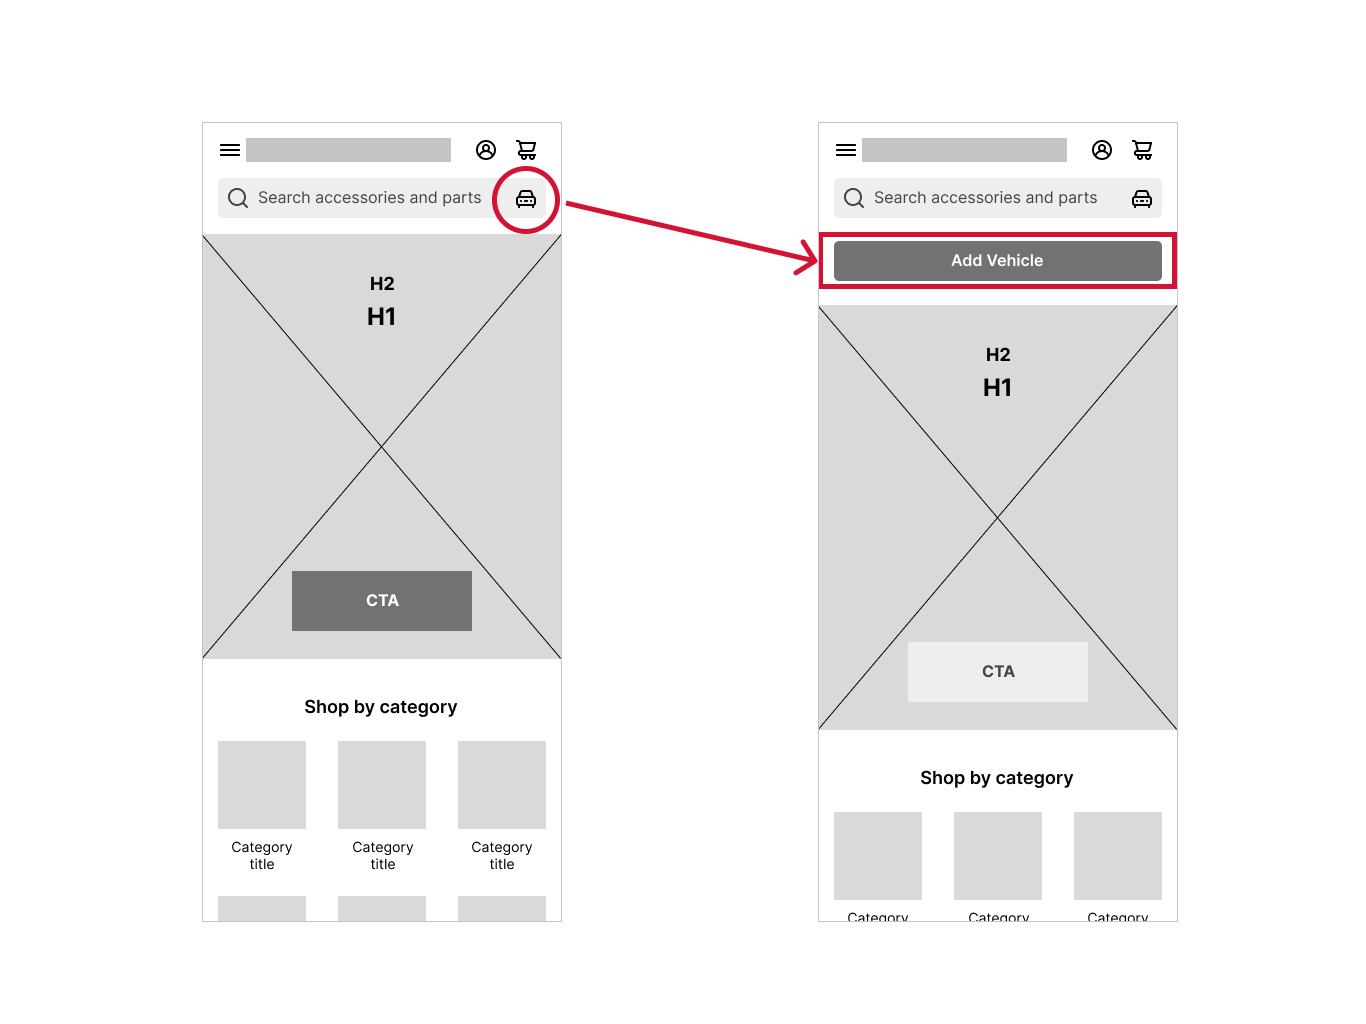
Since this fitment tool is essential for an automotive store, I transformed the car icon into a prominent CTA button, making it highly visible as a key engagement point to set a strong foundation for the rest of the shopping experience.
After another round of user testing, feedback was positive, and the update worked as expected.
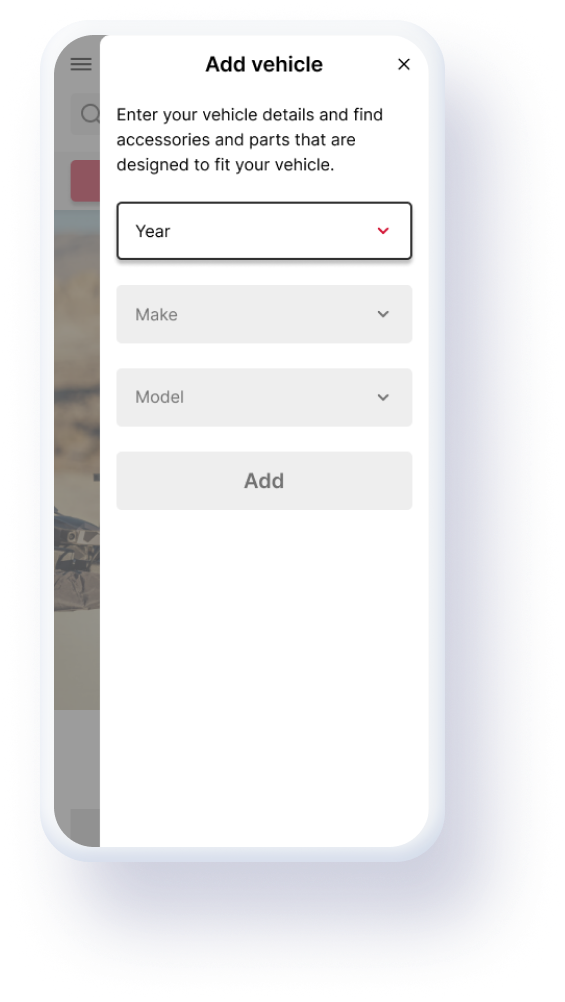
2️⃣ Digital Garage

The digital garage is where users enter their vehicle’s year, make, model to begin their shopping journey.
✅ Users preferred the dropdown menu for its simplicity and ease of use.
⚠️ The picker wheel increased cognitive load, requiring too much back and forth, making it harder to use.
Once the designs were finalized and approved, I moved forward with implementation and updated the colors to be more vibrant for a more energetic and engaging feel, though not without some unexpected challenges.
Challenges & Limitations
Search Speed
Searching for items by vehicle was slow because of the large database, so we spent two weeks improving the speed performance.
Uploading Images
Uploading images for all 690,100 vehicle options was too time-consuming, so we used a placeholder image for now until we found a better scalable solution.

Solution


In the before design, the homepage was dominated by the ‘Select Your Ride’ function, that felt intrusive and unwelcoming. While the fitment tool is essential, it should complement, not overshadow, the shopping experience, especially for first-time visitors.
In the after design, I reimagined the fitment tool as a prominent ‘Add Vehicle’ button placed above the main content. This freed up space for a hero banner, showcasing promotions, products, and categories, giving users confidence to explore.
With vibrant colors and an inviting layout, the homepage felt more like a storefront rather than a data-entry screen. These changes reduced friction, improved engagement, and strengthened the first impression and the metrics reflected that.
Post-Redesigned Metrics (3-Month Data)
📉 Bounce Rate: 80% → 30%
📈 Conversions: 0.7% → 2.1%
Lessons Learned
First impressions matter - Visual appeal and layout greatly impacted trust and engagement.
The trade-off between visual appeal and efficiency - Needed a scalable solution to manage a large vehicle catalog.
Persistent personalization (saved vehicle settings) enhances the customer’s journey.
Next Steps
Keep using data analytics to track user behavior, engagement, and conversions, ensuring ongoing improvements through data-driven design decisions
Introduce an AI-driven parts and accessories recommendation system based on vehicle history.